> ## Documentation Index
> Fetch the complete documentation index at: https://docs.odella.ai/llms.txt
> Use this file to discover all available pages before exploring further.
# Create Chart Block
> Generate data visualizations from tabular data using AI-powered natural language prompts
## Overview
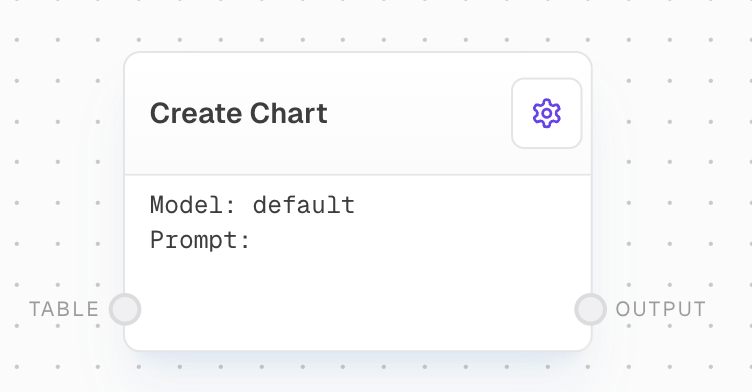
The Create Chart Block leverages AI capabilities to generate data visualizations from tabular data based on natural language prompts. By providing a table of data and a descriptive prompt, you can instruct the AI to create various types of charts, graphs, and other visual representations of your data.
 ## Inputs
The input table containing the data to be visualized. Should be an array of objects, where each object represents a row in the table.
A natural language prompt describing the desired chart or visualization. This input is only available if "Use Prompt Input" is enabled in settings. The prompt guides the AI in generating the appropriate code for creating the chart.
## Outputs
The resulting chart as a PNG image. Can be used directly in image tags or saved as an image file.
The time in milliseconds that the block took to execute.
## Editor Settings
The specific model to use for generating the chart code. Available models are dynamically populated based on the LLM provider configuration. Uses a custom LLM dropdown element.
When enabled, allows the prompt to be provided via an input port instead of being set in the settings.
The prompt to use when "Use Prompt Input" is disabled. Describe the chart you would like to create given the input table. The AI will generate the code for you.
## Error Handling
The block will retry failed attempts up to 3 times with exponential backoff:
* Minimum retry delay: 500ms
* Maximum retry delay: 5000ms
* Retry factor: 2.5x
* Includes randomization
Error messages will be logged and the block will show:
* Code execution errors from the interpreter
* Missing configuration errors
* Response parsing errors
## Notes
* Uses seaborn library for chart generation
* Automatically handles date-time data formatting
* Optimizes charts for clarity and readability
* Includes proper axis labels, legends, and titles
* Limited to 2048 tokens for model responses
## Example Usage
1. Connect your input table to the Table input
2. Enable "Use Prompt Input" if you want to provide the prompt dynamically
3. Write a descriptive prompt like "Create a bar chart showing sales by month"
4. Select your desired AI model
5. The block will generate a PNG chart based on your specifications
## See Also
* [Analyze Table Block](/block-reference/ai/analyze-table)
* [AI Filter Block](/block-reference/ai/ai-filter)
* [Table Block](/block-reference/loaders/read-table)
## Inputs
The input table containing the data to be visualized. Should be an array of objects, where each object represents a row in the table.
A natural language prompt describing the desired chart or visualization. This input is only available if "Use Prompt Input" is enabled in settings. The prompt guides the AI in generating the appropriate code for creating the chart.
## Outputs
The resulting chart as a PNG image. Can be used directly in image tags or saved as an image file.
The time in milliseconds that the block took to execute.
## Editor Settings
The specific model to use for generating the chart code. Available models are dynamically populated based on the LLM provider configuration. Uses a custom LLM dropdown element.
When enabled, allows the prompt to be provided via an input port instead of being set in the settings.
The prompt to use when "Use Prompt Input" is disabled. Describe the chart you would like to create given the input table. The AI will generate the code for you.
## Error Handling
The block will retry failed attempts up to 3 times with exponential backoff:
* Minimum retry delay: 500ms
* Maximum retry delay: 5000ms
* Retry factor: 2.5x
* Includes randomization
Error messages will be logged and the block will show:
* Code execution errors from the interpreter
* Missing configuration errors
* Response parsing errors
## Notes
* Uses seaborn library for chart generation
* Automatically handles date-time data formatting
* Optimizes charts for clarity and readability
* Includes proper axis labels, legends, and titles
* Limited to 2048 tokens for model responses
## Example Usage
1. Connect your input table to the Table input
2. Enable "Use Prompt Input" if you want to provide the prompt dynamically
3. Write a descriptive prompt like "Create a bar chart showing sales by month"
4. Select your desired AI model
5. The block will generate a PNG chart based on your specifications
## See Also
* [Analyze Table Block](/block-reference/ai/analyze-table)
* [AI Filter Block](/block-reference/ai/ai-filter)
* [Table Block](/block-reference/loaders/read-table)