> ## Documentation Index
> Fetch the complete documentation index at: https://docs.odella.ai/llms.txt
> Use this file to discover all available pages before exploring further.
# Live Debugging
> Learn how to debug your workflows in real-time using Odella's live debugging features
Odella offers powerful live debugging capabilities that allow you to inspect the output of each block in your workflow as it executes. This feature enables you to identify and resolve issues quickly, ensuring your workflows perform as expected.
 ## Inspecting Block Outputs
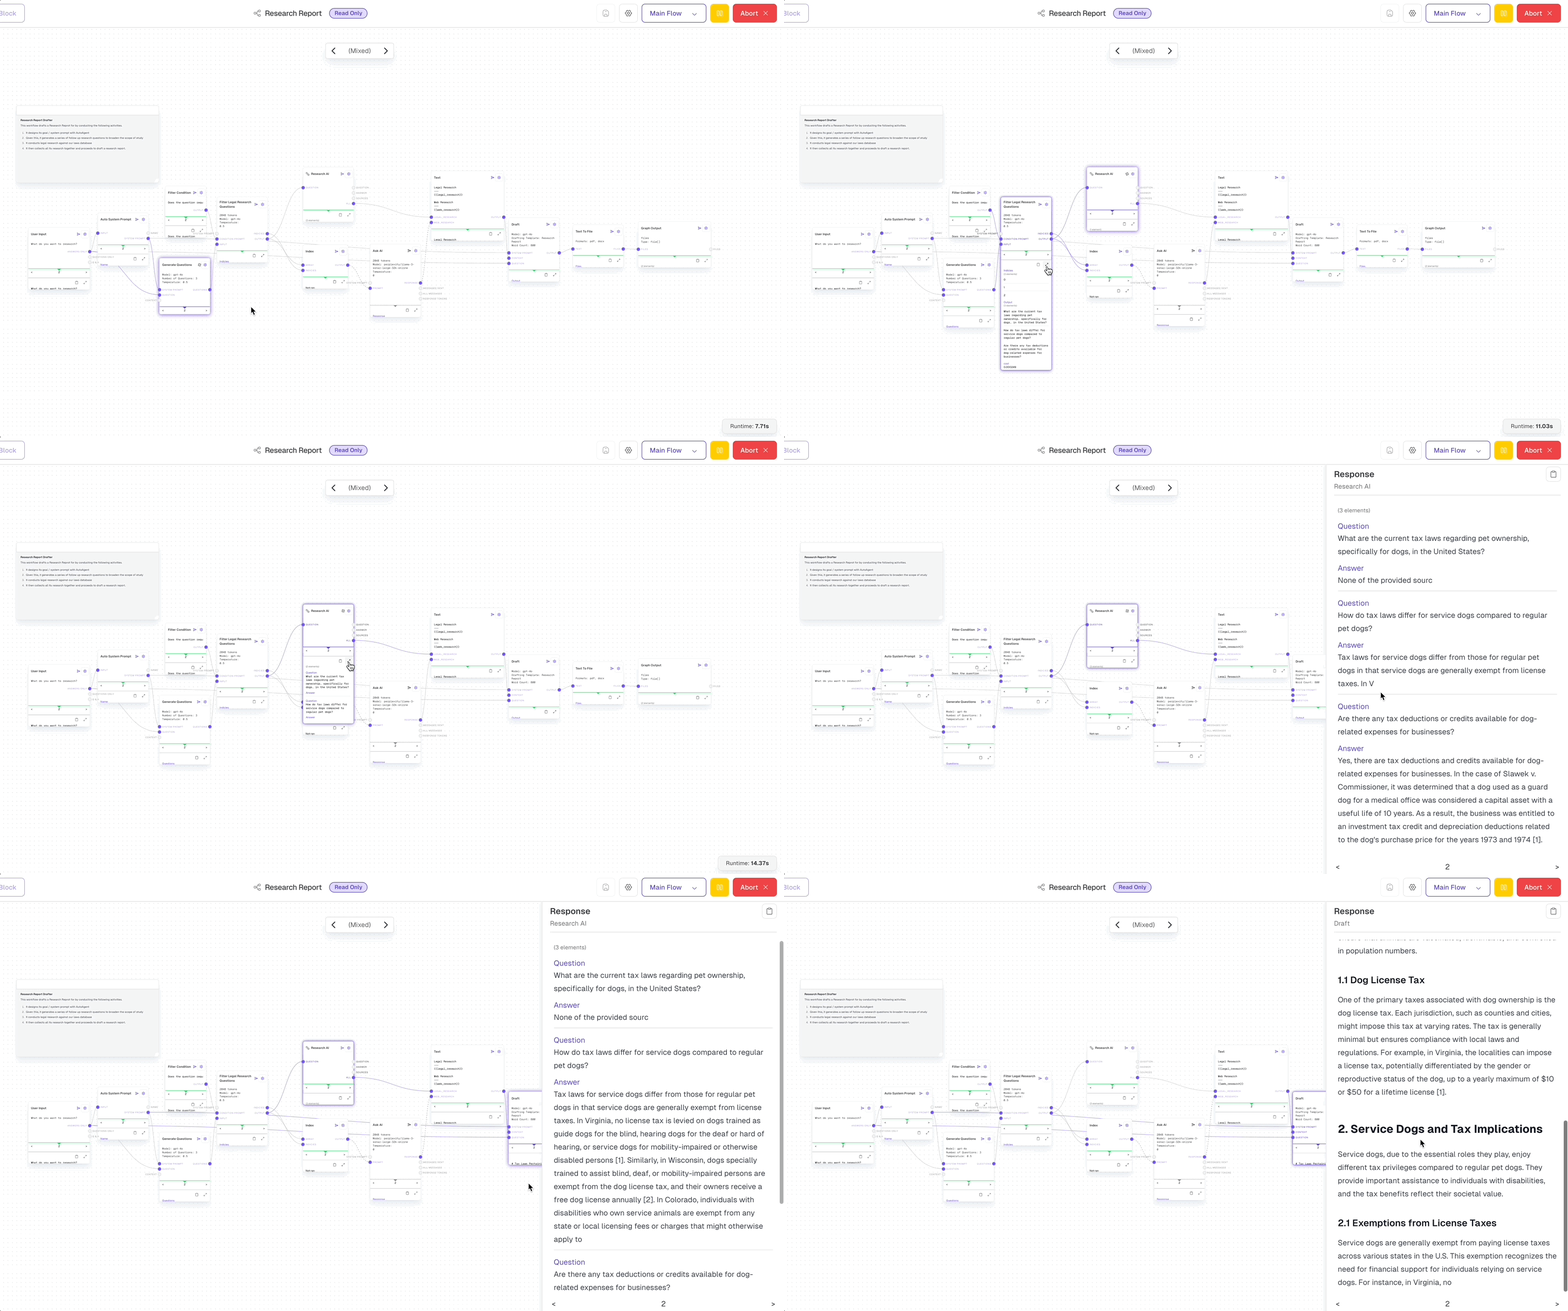
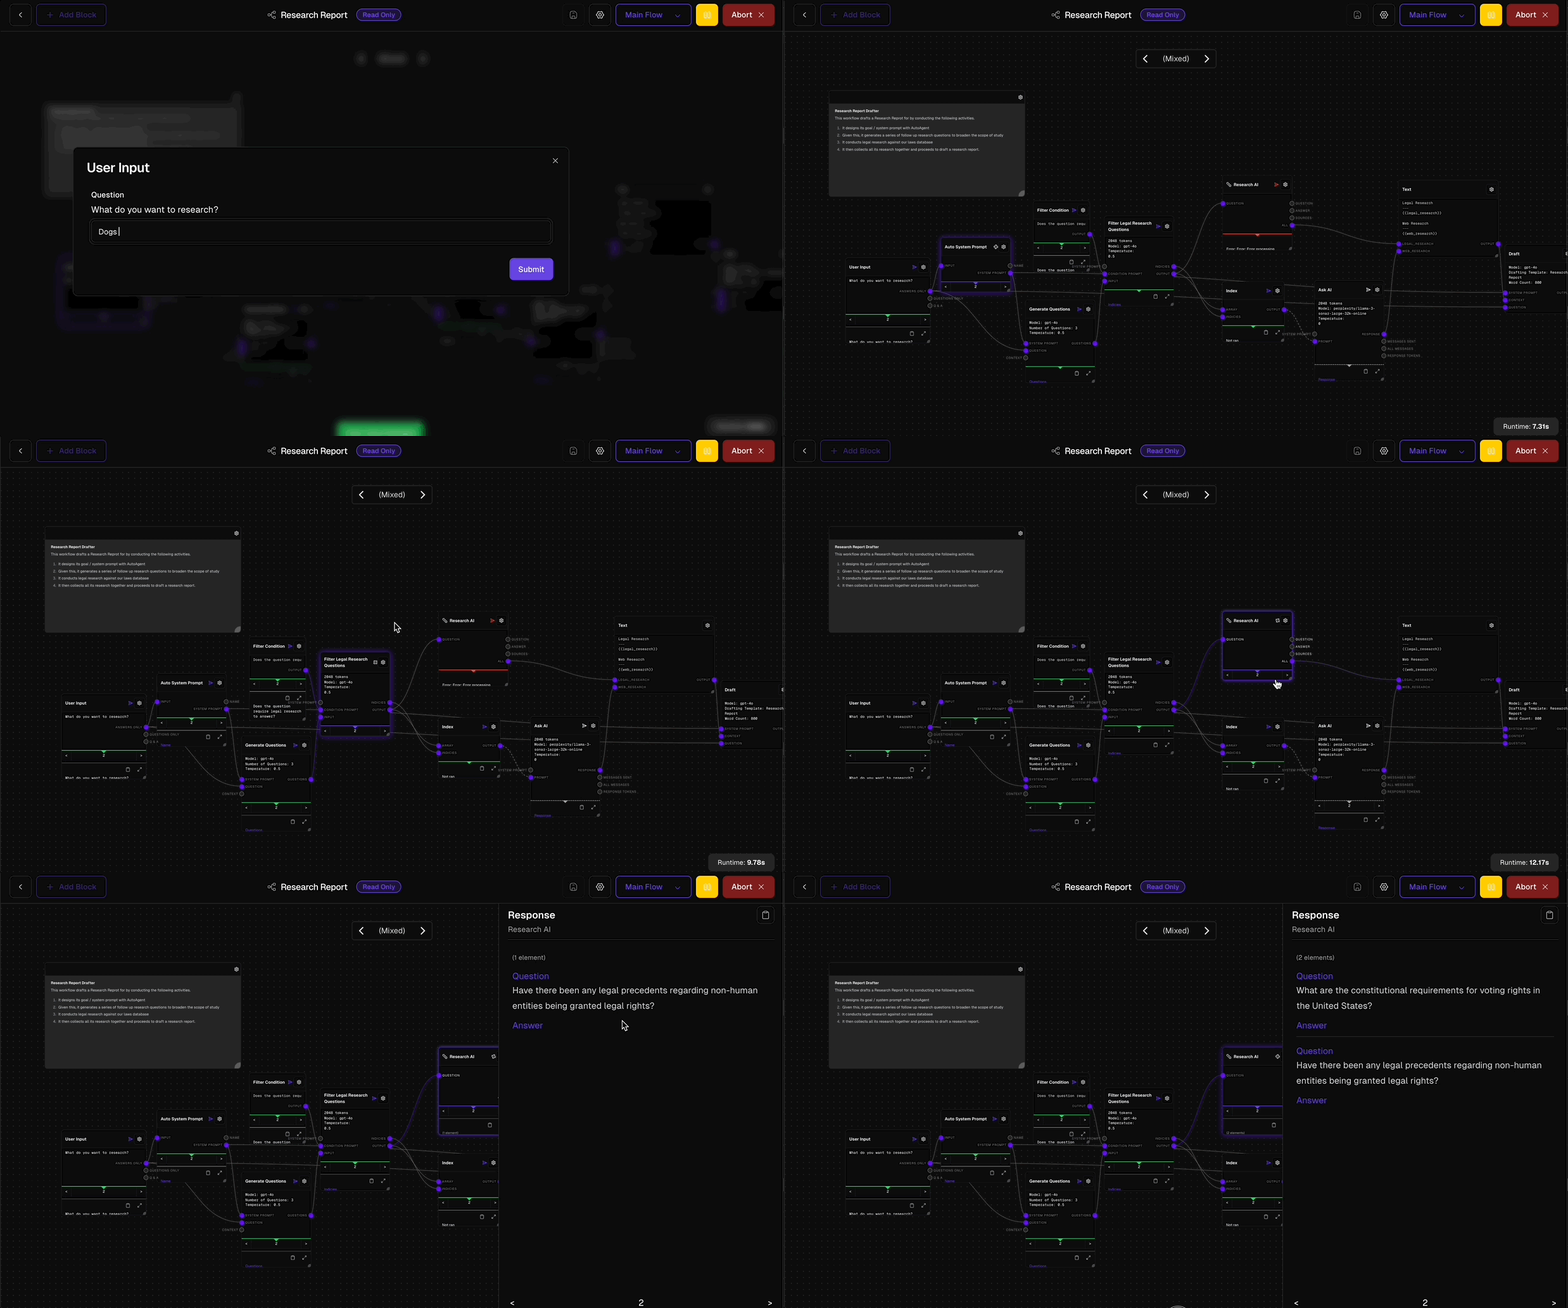
As your workflow runs, you can view the output of each block in real-time. This output appears directly beneath each block in the flow, providing immediate visibility into the data flowing through your workflow.
## Interface Elements
Blocks that are currently executing are highlighted in purple, making it easy to track the progress of your workflow.
When a block runs multiple times, a numeric picker appears above the block's output, allowing you to view results of each execution separately.
A spinner appears next to the flow name in the Flows list when a flow is running, including subflows.
### Currently Executing Blocks
Blocks that are currently executing are highlighted in orange, making it easy to track the progress of your workflow. For certain blocks, such as those involving LLMs, you can hover over the block to see partial outputs as they stream in.
### Execution Picker
When a block runs multiple times (e.g., in a loop or a subflow called multiple times), a numeric picker appears above the block's output. This allows you to view the results of each execution separately.
### Flow Execution Indicator
When a flow is running, including subflows, a spinner appears next to the flow name in the Flows list. Clicking on a flow allows you to view its current state and executing blocks.
## Debugging Controls
Pause the current execution to examine the flow's state without stopping it completely.
Stop the execution entirely when needed.
### Pausing Execution
To pause the current execution, click the **Pause** button in the top right corner. This allows you to examine the current state of the flow without completely stopping it.
### Aborting Execution
If you need to stop the execution entirely, click the **Abort** button in the top right corner.
By utilizing these live debugging features, you can gain deep insights into your workflow's behavior, making it easier to develop, test, and refine your AI-powered legal processes.
## Inspecting Block Outputs
As your workflow runs, you can view the output of each block in real-time. This output appears directly beneath each block in the flow, providing immediate visibility into the data flowing through your workflow.
## Interface Elements
Blocks that are currently executing are highlighted in purple, making it easy to track the progress of your workflow.
When a block runs multiple times, a numeric picker appears above the block's output, allowing you to view results of each execution separately.
A spinner appears next to the flow name in the Flows list when a flow is running, including subflows.
### Currently Executing Blocks
Blocks that are currently executing are highlighted in orange, making it easy to track the progress of your workflow. For certain blocks, such as those involving LLMs, you can hover over the block to see partial outputs as they stream in.
### Execution Picker
When a block runs multiple times (e.g., in a loop or a subflow called multiple times), a numeric picker appears above the block's output. This allows you to view the results of each execution separately.
### Flow Execution Indicator
When a flow is running, including subflows, a spinner appears next to the flow name in the Flows list. Clicking on a flow allows you to view its current state and executing blocks.
## Debugging Controls
Pause the current execution to examine the flow's state without stopping it completely.
Stop the execution entirely when needed.
### Pausing Execution
To pause the current execution, click the **Pause** button in the top right corner. This allows you to examine the current state of the flow without completely stopping it.
### Aborting Execution
If you need to stop the execution entirely, click the **Abort** button in the top right corner.
By utilizing these live debugging features, you can gain deep insights into your workflow's behavior, making it easier to develop, test, and refine your AI-powered legal processes.